
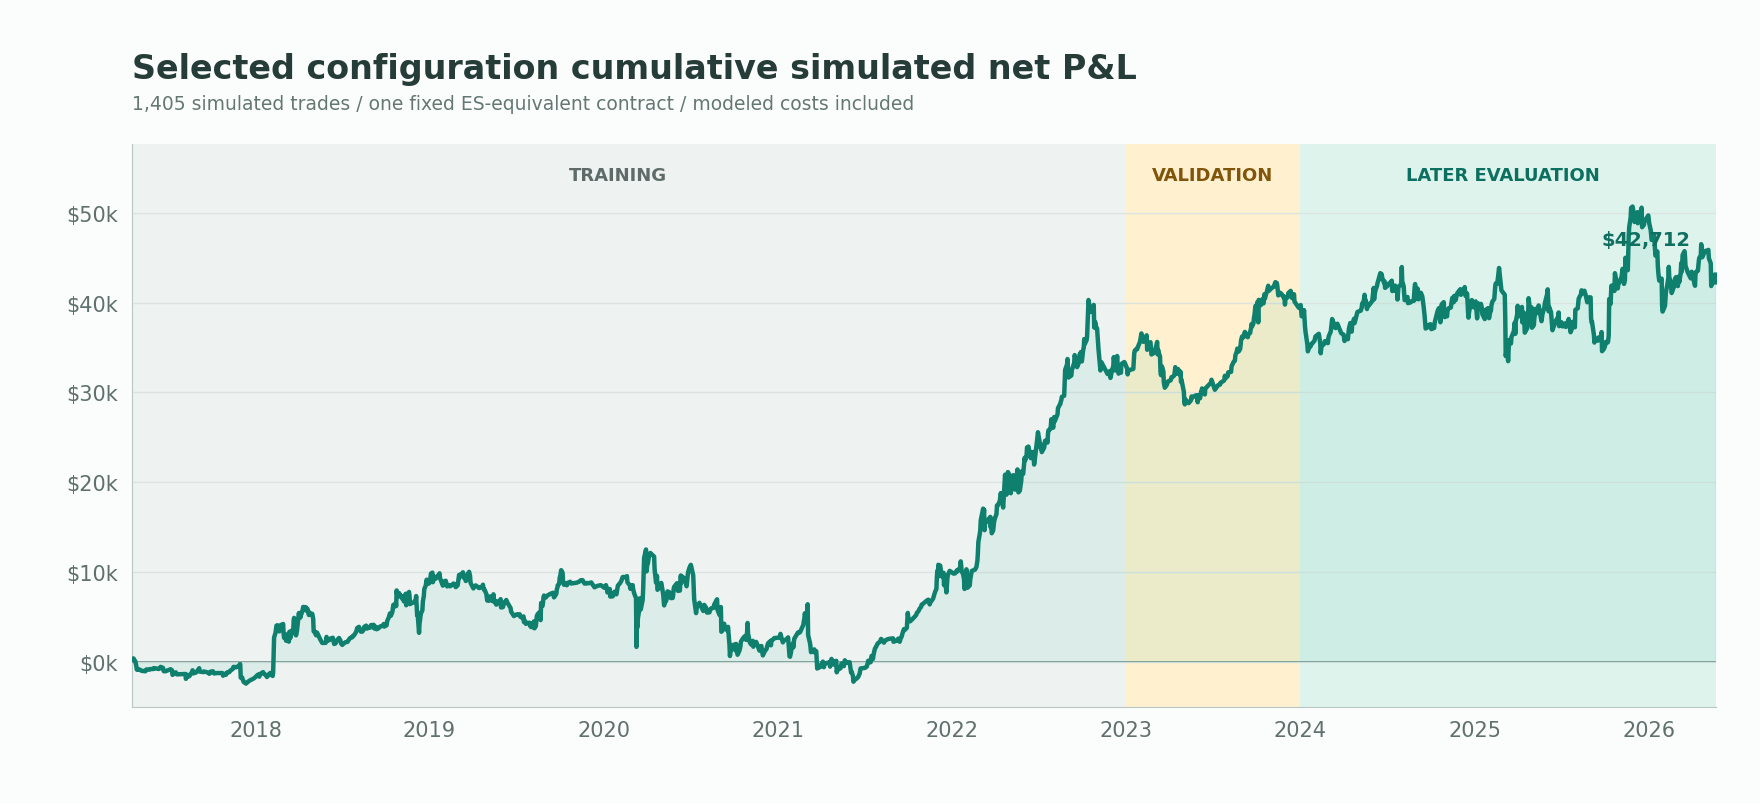
What the historical simulation shows.
April 17, 2017 to May 22, 2026. That’s over nine years of one-minute ES and NQ data, across 2,359 sessions.
The simulation was profitable after modeled costs.
Simulated results by evaluation stage
One fixed ES-equivalent contract. The model uses adverse ticks, $5 round-trip commission and stop-first handling for same-minute collisions. These assumptions do not establish all-in live costs.
388 trades · 62.4% win rate · 1.025 profit factor · $3,272.50 net · approximately $8 net per trade.
| Stage | Trades | Win rate | Profit factor | Avg planned R:R | Net P&L |
|---|---|---|---|---|---|
| Training2017-2022 | 862 | 66.4% | 1.181 | 0.615:1 | $33,315.00 |
| Validation2023 | 155 | 67.7% | 1.191 | 0.599:1 | $6,125.00 |
| Later evaluation2024-May 2026 | 388 | 62.4% | 1.025 | 0.661:1 | $3,272.50 |
Full selected sample · April 2017–May 2026
- Simulated win rate
- 65.4%
- Profit factor
- 1.123
- Simulated net P&L
- $42,712.50
- Simulated trades
- 1,405
- Average net per trade
- $30
- Research window
- 9+ years
Method
- Training scores ranked candidate configurations. The manifest records 384 scored training rows.
- The analysis code selected the best validation score among 15 combined finalists. It separately evaluated 20 IVB finalists.
- The configuration was selected before its later-period results were calculated. All finalists then received retrospective later-period metrics.
The later period is a retrospective evaluation. The research record does not establish an independent, externally frozen test.
Strategy rules and signal sequence
Session state
Reset at the New York trading date and build the 09:30-10:30 opening range.
Derived levels
Calculate opening-range bounds, VWAP bands, prior-day ATR, and volatility-regime flags.
Qualification
Evaluate fixed price, volatility, trend, NQ-context, and rank conditions.
Arbitration
Resolve IB and IVB candidates in a fixed order and accept the first valid session signal.
Risk map
Set the entry reference, initial stop, target, planned R, and break-even behavior from formulas.
Exit
Resolve target, stop, time exit, and same-bar collisions according to declared priority.
IB and IVB results and definitions
IB is the primary setup family; IVB is a second setup family. Both share qualification, risk, arbitration and first-signal controls.
| Setup | Trades | Win rate | Profit factor | Planned R:R | Net P&L |
|---|---|---|---|---|---|
| IBPrimary IB setup | 1,142 | 69.8% | 1.138 | 0.412:1 | $39,277.50 |
| IVBIVB setup | 263 | 46.4% | 1.054 | 1.554:1 | $3,435.00 |
Profit factor is gross winning P&L divided by absolute gross losing P&L. Planned R:R compares the initial target and stop; it is not the realized average-win to average-loss ratio.
documented rules: Fixed timestamps, formulas, and Boolean conditions define the opportunity, entry, stop, target, and session lock.
opening-session focus: The framework turns opening-range information into structured decisions during defined post-open windows.
multi-factor qualification: Price, volatility, trend, NQ context, and rank gates work together to filter candidate setups.
predefined risk map: Every accepted signal receives an initial stop, a target, a planned R value, and optional break-even behavior.
session signal limit: Fixed arbitration and a first-signal lock create one clear answer for the session.
built for review: The same versioned rules make alerts, theoretical fills, and actual fills easier to track consistently.
Research files
Download the review, trade records, and evaluation data.
- Current research review (PDF)
- Research manifest and unresolved issues (JSON)
- Selected trade ledger (CSV)
- Finalist evaluation (CSV)
- Parameter search (CSV)
- Annual results (CSV)
- Baseline trades (CSV)